
As streaming reaches record-high viewership, so does the importance of navigation, visibility, and subscription. Explore CTAM’s curated stats, trends, and insights revealing how perceptions and usage habits are shifting.
Streaming Viewership
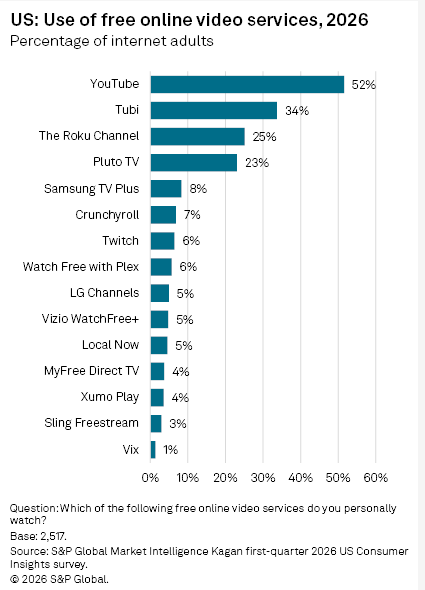
- Americans watch an average of two (2) free online video services. (Source: S&P Global Market Intelligence Kagan, 1Q 2026)
- Nearly one-quarter (23%) of respondents said they spent more time watching free online video over the past year compared to 16% that reported fewer viewing hours. (Source: S&P Global Market Intelligence Kagan, 1Q 2026)
- Despite a substantial decline in viewership over the past two years, the majority (52%) of surveyed adults still reported watching YouTube videos. (Source: S&P Global Market Intelligence Kagan, 1Q 2026)
- Approximately one-quarter of respondents said they watch either The Roku Channel (25%) or Pluto TV (23%). (Source: S&P Global Market Intelligence Kagan, 1Q 2026)
- The long tail of competitors ranges from Samsung TV (8%) to Vix (1%). (Source: S&P Global Market Intelligence Kagan, 1Q 2026)
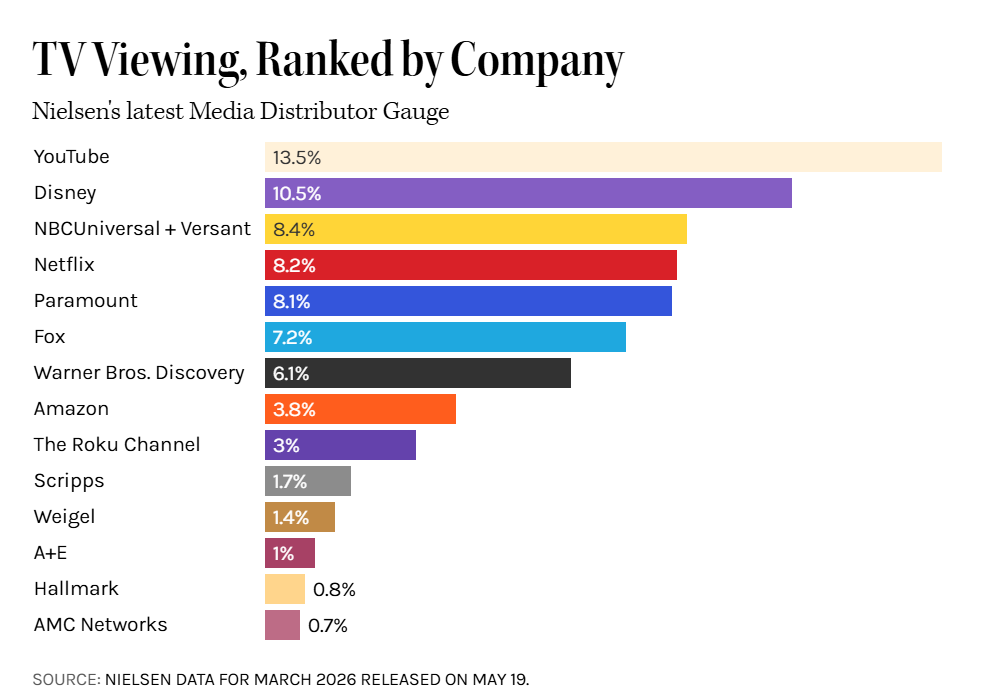
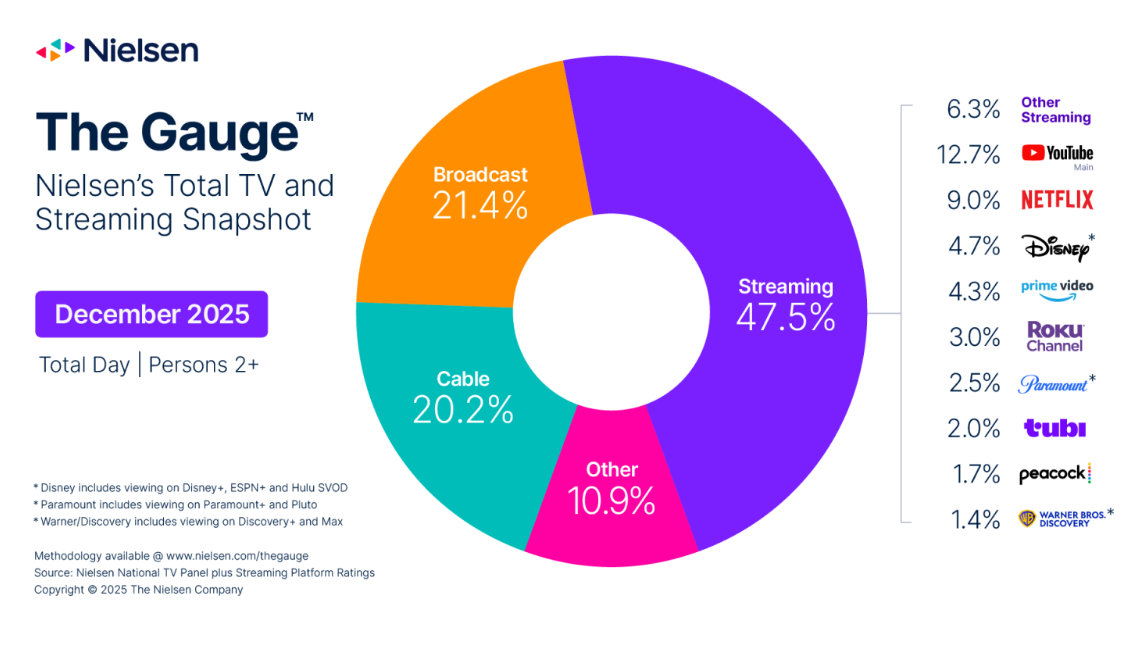
- Current viewing share across streamers continued YouTube strength with competition closing the gap (Nielsen Media Distributor Gauge for December 2025)
- Streaming Shatters Multiple Records in December 2025 with 47.5% of TV Viewing (Nielsen)
- Paid live TV bundles (MVPD + vMVPD) grew by half a million subscribers in Q3 2025, reaching 69.1 million total. (MoffettNathanson, 2025)
The improved quarterly performance was driven by:
- The fewest subscriber losses for traditional pay TV providers in seven years.
- Growth across most vMVPD services.
- A significant seasonal boost from the return of the National Football League (NFL) season.
- Spectrum led MVPD subscriber stability in Q3 2025 at 12.6 million subscribers thanks to strategic SVOD bundling that gave TV Select customers over $100 in streaming value, supporting retention. (MoffettNathanson, 2025)
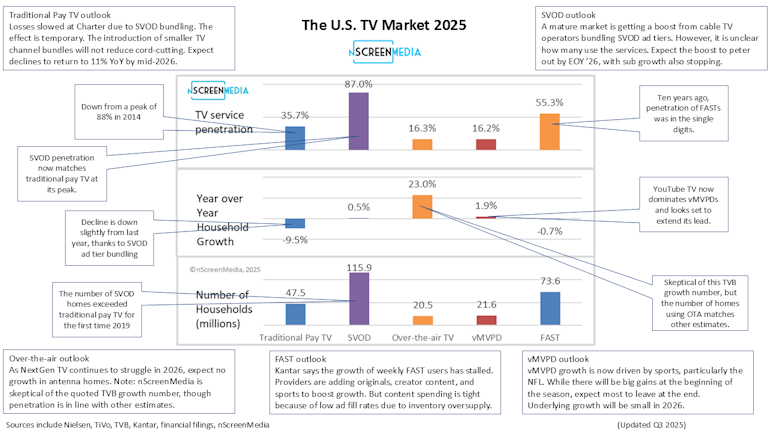
Click here to read more and view larger graphics from nScreenMedia.
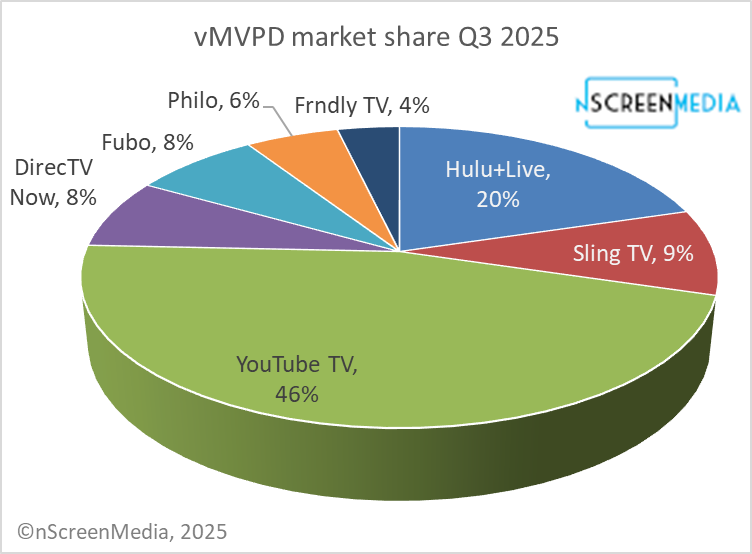
- YouTube TV continues to drive growth in the vMVPD sector, adding an estimated 750,000 subscribers in Q3 2025 to reach approximately 10 million total subscribers. (MoffettNathanson, 2025)
Viewer Perceptions
- 63% say the top reason for watching content released 10+ years ago is because it’s simply good (vs. 23% who choose what to watch based on the newness of the content). (The Stream, HarrisX/Tubi, 2026)
- More than 40% of consumers eye social media video and streaming as “watching TV”. (Deloitte, October 2025)
- Deloitte reported that over two-fifths (41%) of surveyed consumers consider watching videos on social media and streaming platforms as forms of “watching TV.” (Deloitte, October 2025)
Consumer Subscription Behavior
-
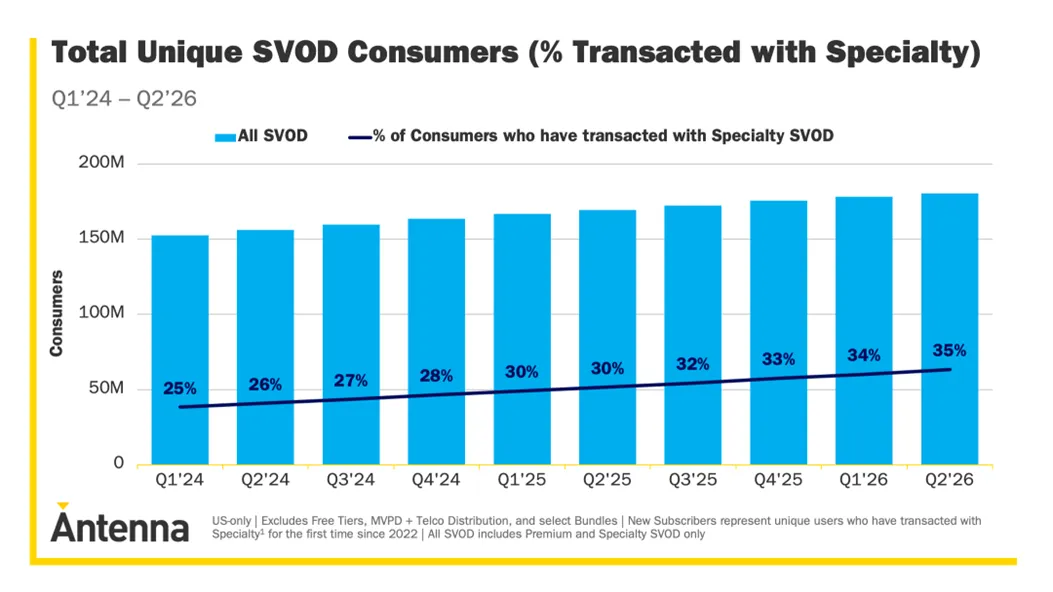
35% of US SVOD consumers have now tried a Specialty SVOD service, up from 26% two years ago. (Source: Antenna, August 2026)
-
Between Q2’24 and Q2’26, Specialty SVOD consumers grew 55%, from 41.0M to 63.6M. (Source: Antenna, August 2026)
-
In the past year, 12M consumers tried a Specialty SVOD service for the first time. (Source: Antenna, August 2026)
Note: Specialty SVOD services are niche streaming platforms targeting specific genres, interest groups, or demographics. Examples include BritBox, AMC+, Crunchyroll.
-
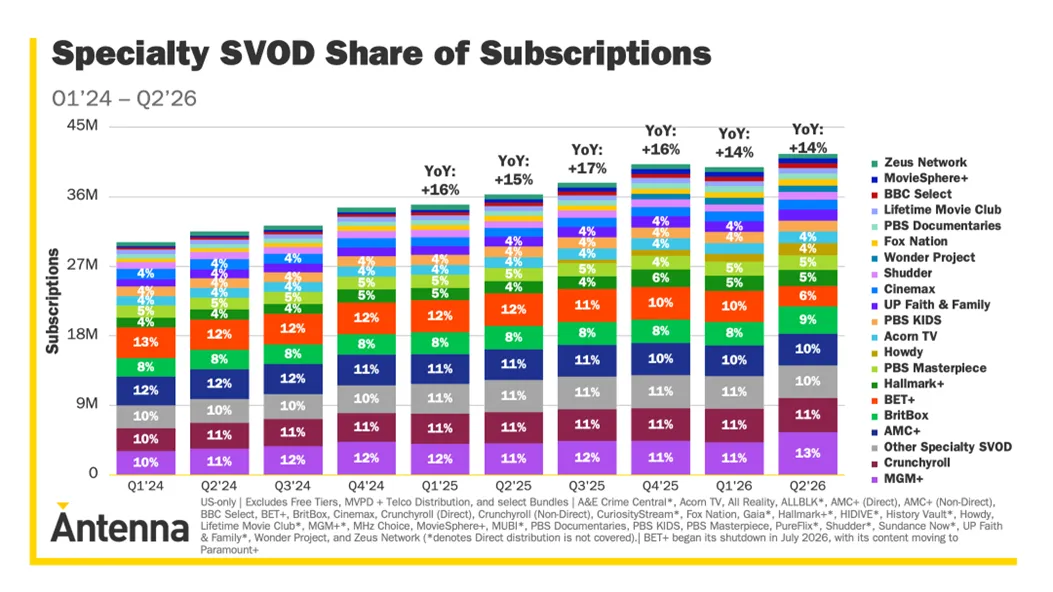
Behind that expansion, Specialty SVOD Subscriptions grew 14% YoY in Q2’26, more than double Premium SVOD’s 6% growth, outpacing the 7% growth of the total SVOD category. (Source: Antenna, August 2026)
-
With growth occurring at varying speeds, Premium growth has slowed while Specialty growth has held with a rising share of streaming consumers discovering Specialty SVOD. (Source: Antenna, August 2026)
Note: Premium SVOD (Subscription Video on Demand) services are direct-to-consumer streaming platforms offering mass-market, broad-appeal, traditionally-higher-budget entertainment for a recurring subscription fee (either ad-free or ad-supported).
- Over twice as many Americans (29%) said they spent less on SVOD subscriptions over the past 12 months than those who increased their SVOD spending (12%) during 2025. (Source: S&P Global Market Intelligence Kagan, 1Q 2026)
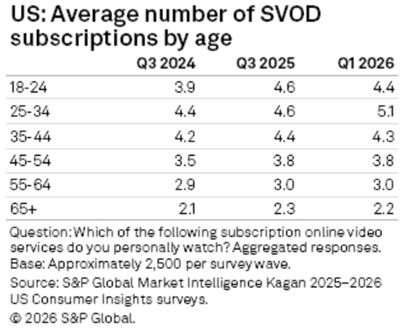
- The number of SVOD subscriptions per individual is not growing to keep up with the growth of available streaming channels. (Source: S&P Global Market Intelligence Kagan, 1Q 2026)
- The average number of SVOD subscriptions in 2026 has remained constant or decreased very slightly compared to previous years with A25-34 having the most subscriptions (averaging 5.1). (Source: S&P Global Market Intelligence Kagan, 1Q 2026)
- Low price is the greatest factor in how viewers perceive the value of their streaming services. (EMarketer, 2026)

- 74% of people have (or would) cancel their streaming subscription because of a price increase. (The Stream, HarrisX/Tubi, 2026)
- Half of viewers (and 65% of Gen Z) say that password crackdowns and having to pay for ad-supported content are major reasons to cancel a subscription. (The Stream, HarrisX/Tubi, 2026)
- 67% would not share their streaming login information with a potential partner unless they were seriously dating. (The Stream, HarrisX/Tubi, 2026)
- 67% have skipped a new show or movie once they realized they would have to pay for streaming service. (The Stream, HarrisX/Tubi, 2026)

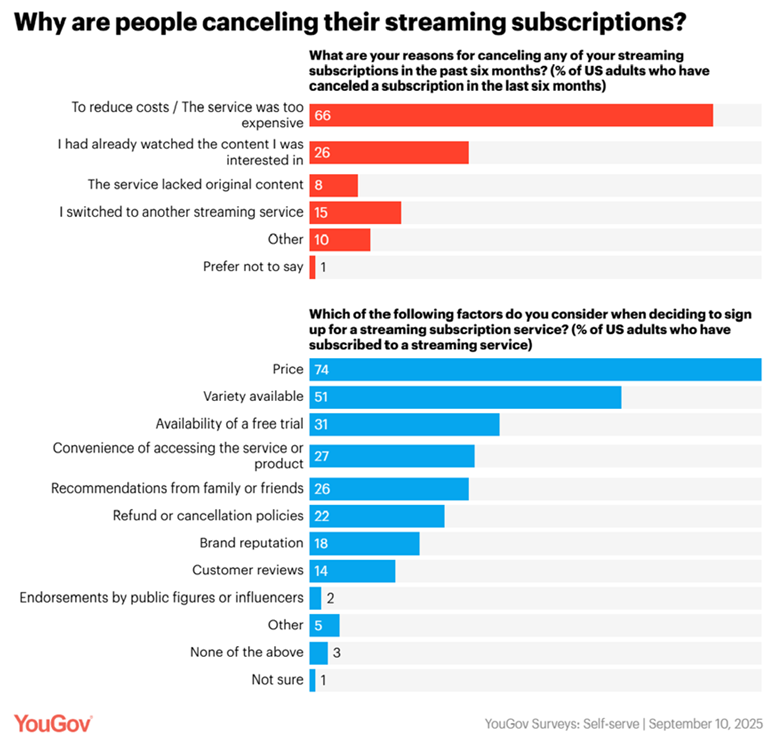
- About half (49%) of consumers changed their streaming subscriptions in the past six months. (YouGov Survey, September 2025)
- Two-thirds (66%) of consumers cancel streaming services because they are too expensive. (YouGov Survey, September 2025)
- Three-quarters (74%) of consumers consider cost when choosing a streaming service. (YouGov Survey, September 2025)
- Over half (51%) of consumers focus on content variety when choosing a streaming service. (YouGov Survey, September 2025)
- Over one-third (36%) of consumers pay for at least one streaming service they haven’t used in six months. (YouGov Survey, September 2025)